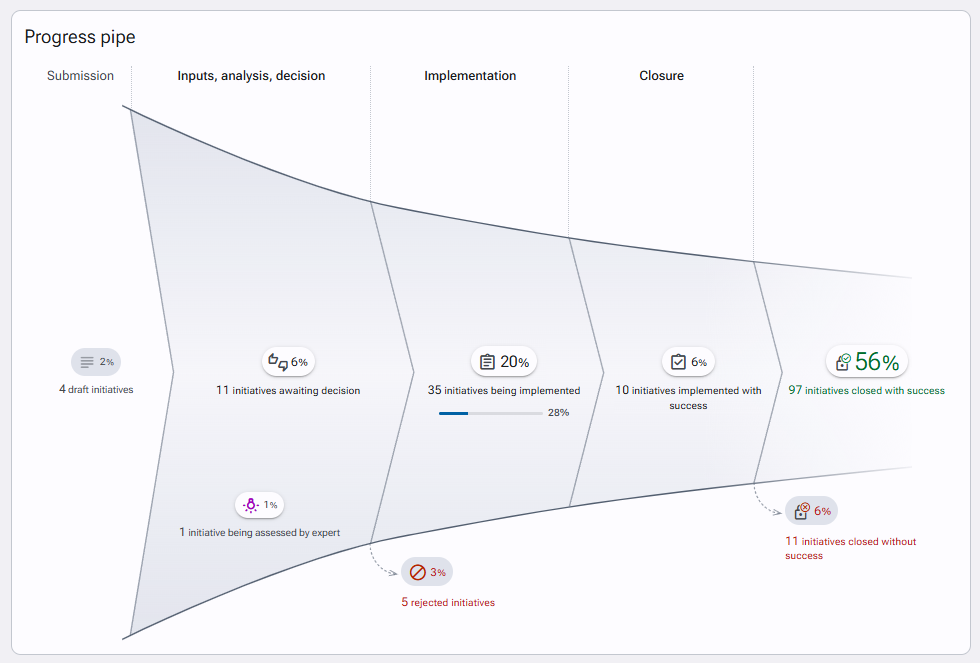
The initiative reporting provides information on a portfolio of selected initiatives through a multi-criteria search engine. The different reports cover a number of initiatives presented in various formats:
Initiative Progression
The initiative progression report offers a graphical representation in the form of a "tunnel" displaying the status of each initiative (Awaiting decision or Further details needed, Currently implemented or To be scheduled, Pending closure, Closed), along with the number and proportion of initiatives in each stage. Each section is clickable and provides a list of the corresponding initiatives.
Flow of initiatives
“Flow of initiatives” provide a graphical representation of the evolution of the number of published, closed, and rejected initiatives per period (weekly, monthly, or yearly), both individually and cumulatively.
Hovering the mouse cursor over the intersections between the flow curve and the various time indicators reveals the precise number of initiatives. By clicking on each point, it is possible to obtain the list of corresponding initiatives.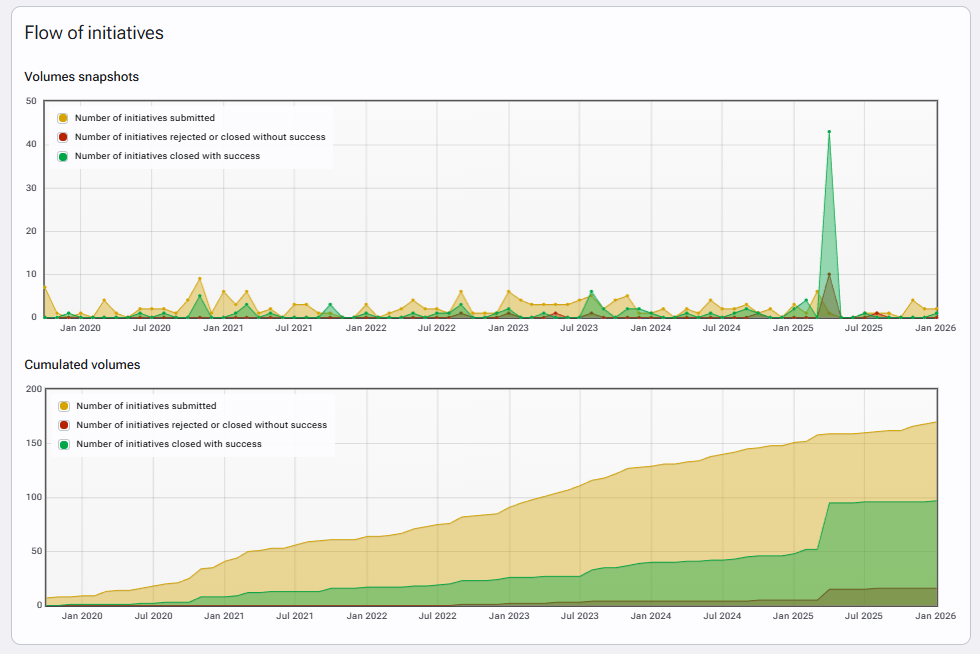
Initiative opportunity mapping (if the module “Analysis matrix” is enabled)
The initiative opportunity mapping provides a graphical representation that positions the initiatives that have undergone an opportunity analysis on a Result/Feasibility matrix. By default, approved and implemented initiatives are displayed. Display options allow for filtering by status and/or grouping by zone.
Each zone in the matrix is clickable and displays the list of corresponding initiatives.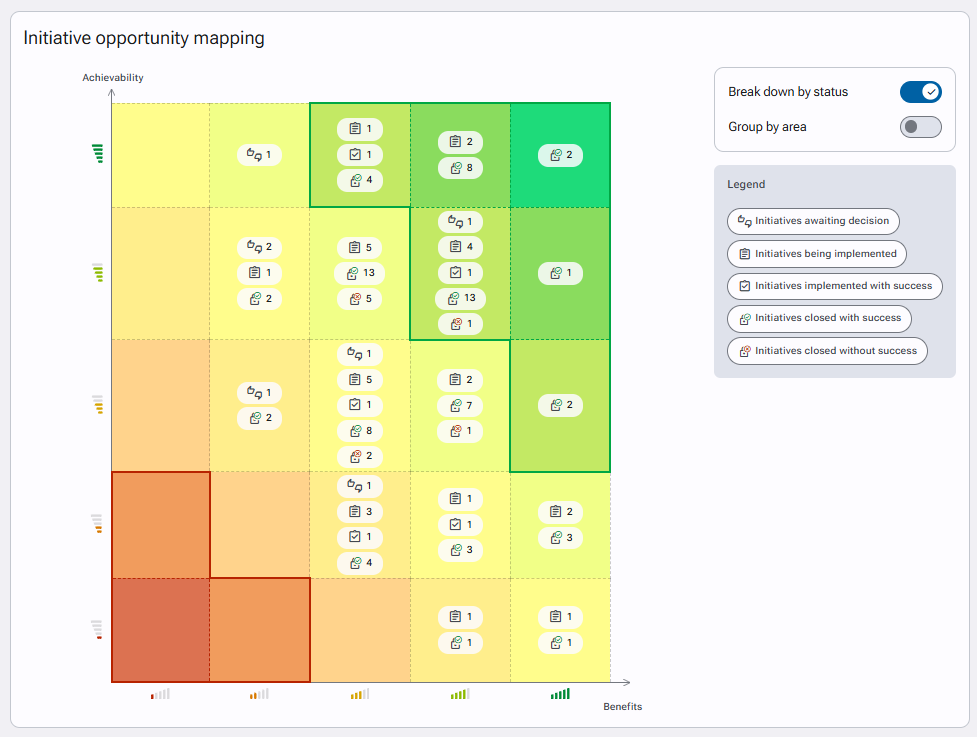
The Implementation schedule (if the "Schedule" module is enabled)
The implementation schedule provides a graphical representation in the form of a Gantt chart of initiative progress. Display options allow for selecting non-approved initiatives, initiatives currently in progress, and/or initiatives already implemented.
Here is an article detailing how to effectively read your implementation schedule.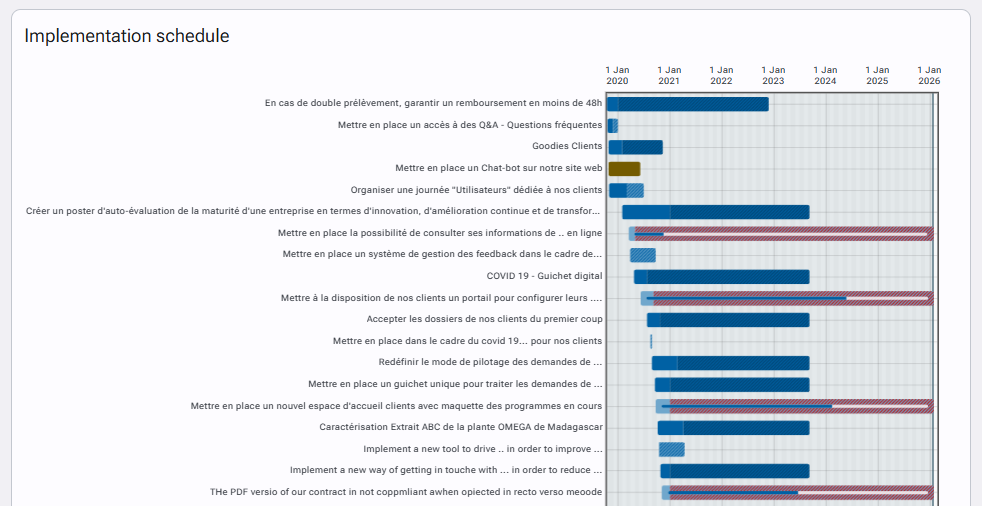
Statistics of initiatives processing
- “Statistics of initiatives processing” presents various information illustrating the handling of initiatives. These are calculated based on the filters used when generating your report (by default, all initiatives except those archived).
- Approval rate: the proportion of approved initiatives.
- Successful closure rate: the proportion of successfully closed initiatives.
- Number and proportion of delayed initiatives.
- Average time of delays: the total number of days of delay divided by the total number of initiatives currently being processed.
- Age of initiatives being processed: the average number of days elapsed since the declaration date of initiatives still being processed.
- Time until decision: the average number of days to make a decision.
- Time until closure: the average number of days to close an initiative.
- Implementation time: the average number of days to complete an initiative.
- Rate of initiatives in progress (currently being processed).
- Distribution of initiatives currently being processed (represented in a pie chart).
- Breakdown of implementation by phase (if the "Tasks" module is enabled).
- Use of action plans (if the "Tasks" module is enabled), including the number of implemented initiatives with and without action plans, and the progress of tasks.
- Initiatives breakdown by reason for rejection
Origin of initiatives
Reporting by origin provides a distribution of initiatives based on different organizational structures defined; the origin of the initiative being derived from the organizational affiliation of its author.
It is possible to choose different levels of consolidation.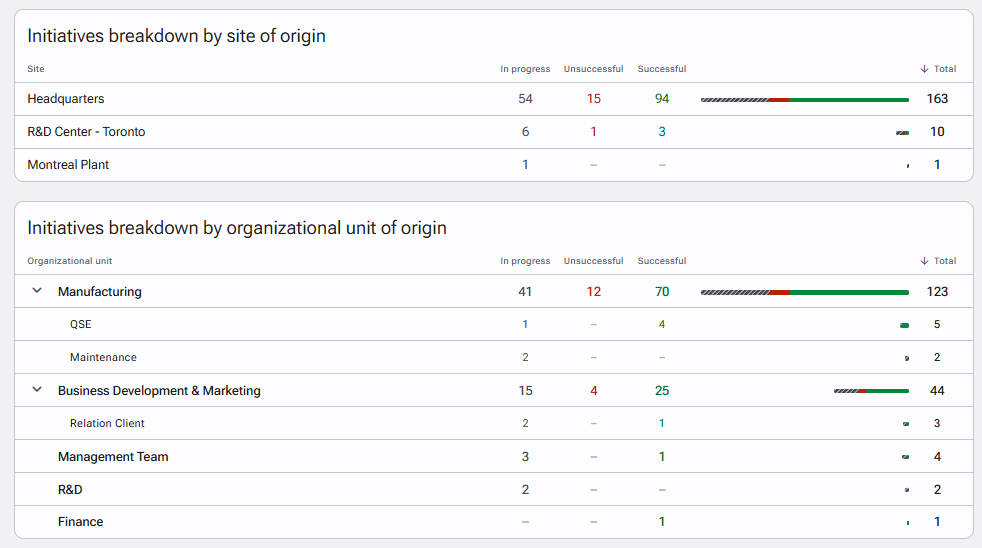
Plans and Domains (if the "Plans" module is enabled)
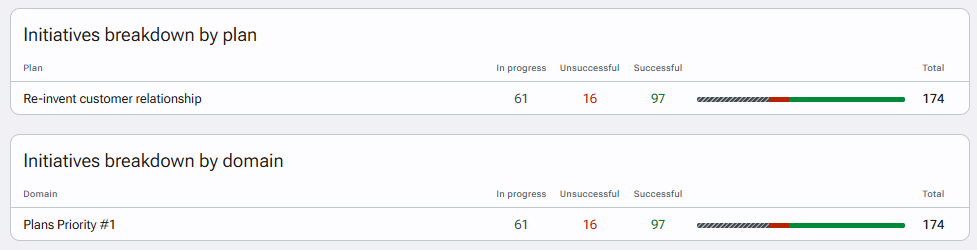
Reporting on plans and domains provides a distribution of selected initiatives by plans or domains. Several reports are available:
- Rate of initiatives assigned to a plan.
- Initiatives breakdown by plan.
- Initiatives breakdown by domain.
- Initiatives breakdown by domain and plan.
- It is possible to choose different levels of consolidation for domains.
Scope of initiatives
Scope reporting provides a distribution of initiatives based on different defined organizational structures (sites, organizational units, processes, products), with the scope of the initiative being the one specified in the initiative target (affected scope) at the time of declaration.
It is possible to choose different levels of consolidation for organizational units and processes.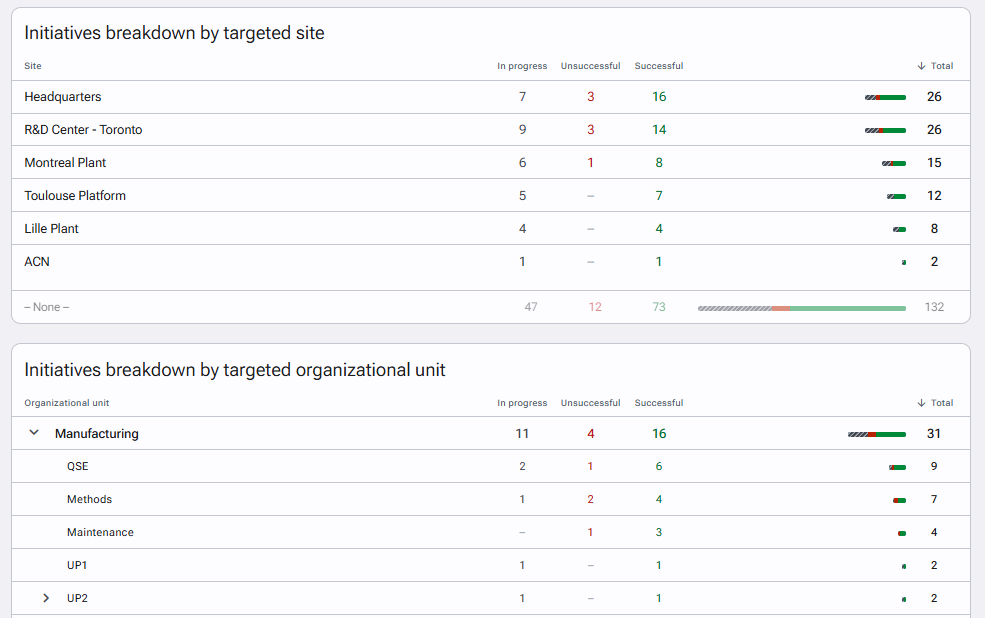
Classification (if the "Classification" module is enabled)
The classification reporting provides a breakdown of selected initiatives by category, class, or triggering event. It is possible to choose different levels of consolidation for typologies and types of events.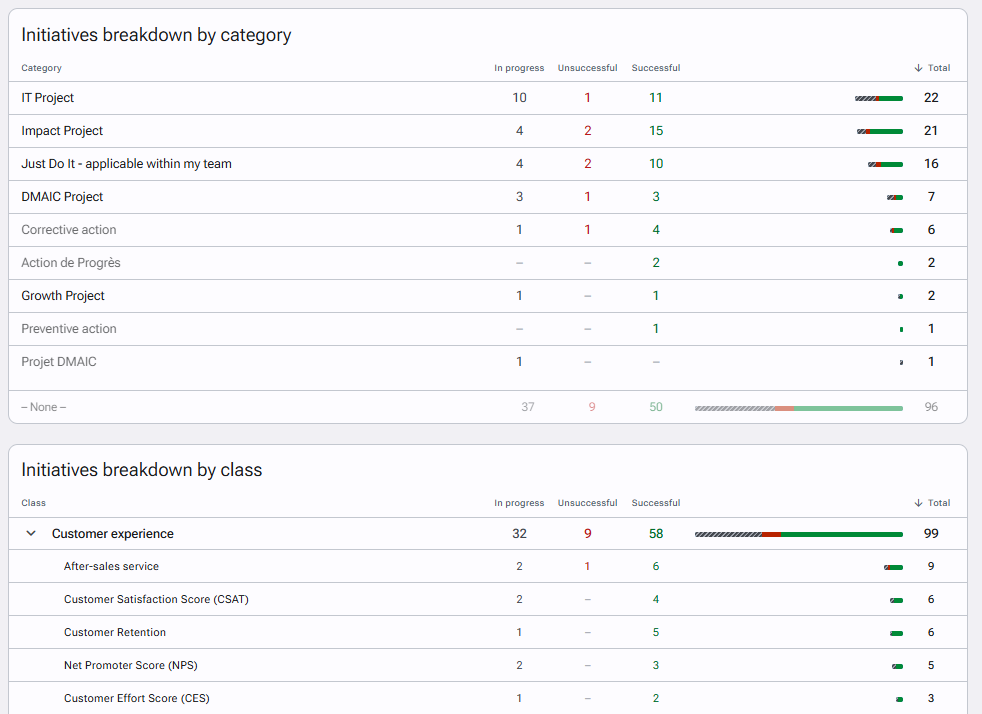
Stakeholders
Stakeholder reporting provides a breakdown of selected initiatives by stakeholder and type of stakeholder type. It is possible to choose different levels of consolidation for type of stakeholder.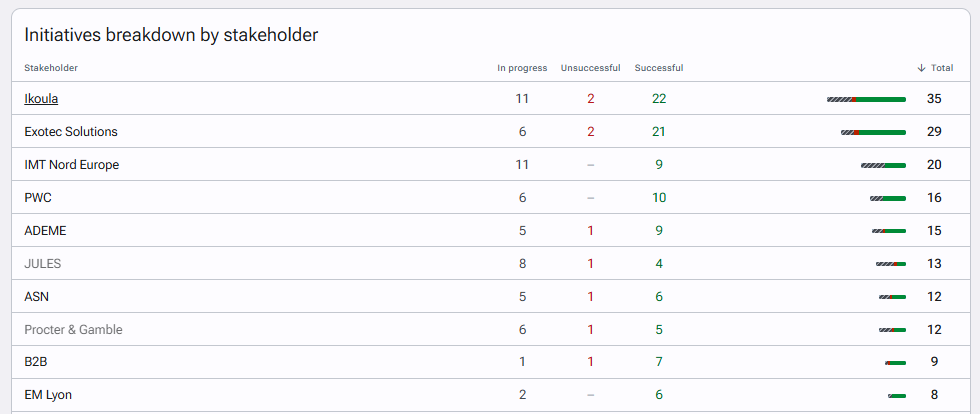
Risks
Risk reporting provides a distribution of selected initiatives by risk and type of risk. It is possible to choose different levels of consolidation for type of risk.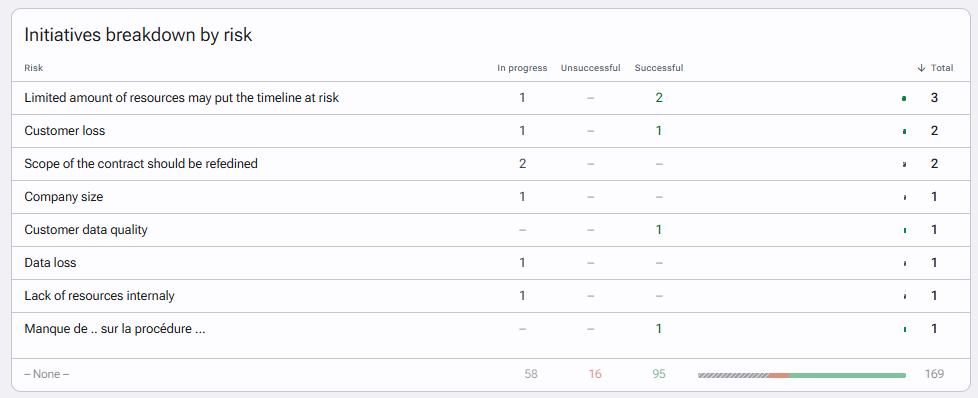
Financial reporting (if the "Financial Analysis" module is enabled)
Financial reporting offers various levels of consolidation for the costs and gains of selected initiatives.
Several types of reports are available:
- Details of initial amounts
- Details of forecast amounts
- Details of actual amounts
- Comparison between initial and forecast amounts
- Comparison between initial and actual amounts
- Comparison between forecast and actual amounts
The following consolidation levels are distinguished:
- Summary by type of gains offers three levels of consolidation
- Identified amounts correspond to non-approved initiatives
- Engaged amounts correspond to approved initiatives
- Secured amounts correspond to closed initiatives with or without success
- Amounts allocation by P&L center with a choice of consolidation level provides a breakdown of gains based on different defined P&L centers.
- Amounts allocation by cost structure with a choice of consolidation level provides a breakdown of gains based on different defined cost structures.
- Amounts allocation over time offers a breakdown of gains per period based on the chosen option (monthly or yearly) and cumulative.
- Amounts allocation by initiative with the possibility to include detailed calculation lines offers a breakdown of gains per initiative.
Additional options allow filtering of gains by period, P&L center, cost structure, and financial control status.
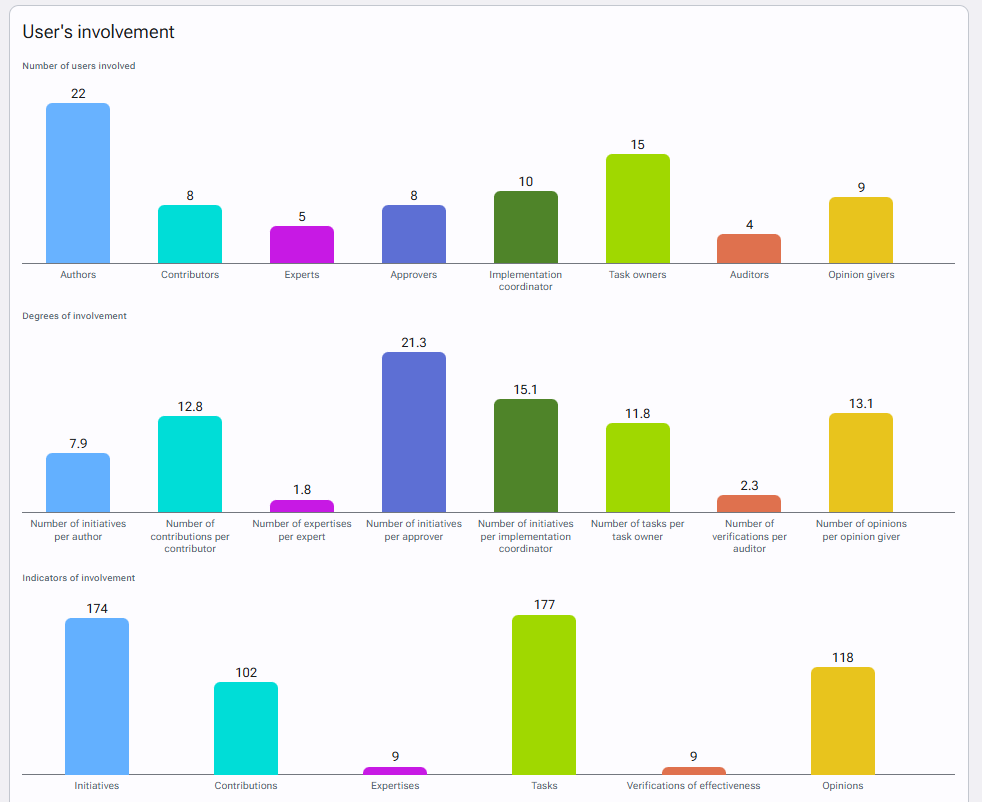
User’s involvement
User’s involment reporting provides information on the involvement of a selected population through a multi-criteria search engine. The following roles are distinguished:
- Authors
- Contributors
- Experts
- Approvers
- Implementation coordinators
- Task owners
- Auditors
- Reviewers
It allows you to determine the different participation rates (proportion of actors compared to the total number of selected users).